


Line Chart
Introduction
Functions
A line chart is used to show the changes in data over a continuous time interval or time span. It is to reflect the trend of changes over time or in ordered categories.
Application Scenarios
In a line chart, the horizontal axis (X-axis) usually represents time and has intervals of equal length; whereas the vertical axis (Y-axis) represents data at different moments. The following picture shows the changes in the daily view of books over time.

Basic Requirements
To use the line chart, you need add at least one fields to Measure when you add one field to Dimension. When you add two fields to Dimension, you can only add one field to Measure.
Chart Type | Dimension | Measure |
Line Chart | One | ≥ One |
Line Chart | Two | One |
Setting Procedure
Creating a Line Chart
1. Select the dashboard where you need to create a line chart, or you can create a new dashboard. Then click Stats, and choose the data source. The data source can be data from forms, the data factory or aggregate tables.

2. Set the name, data permissions, and the chart type as Line Chart.

Adding Fields to Dimension and Measure
Drag and drop one field you want to analyze from the left field panel into Dimension and Measure respectively.
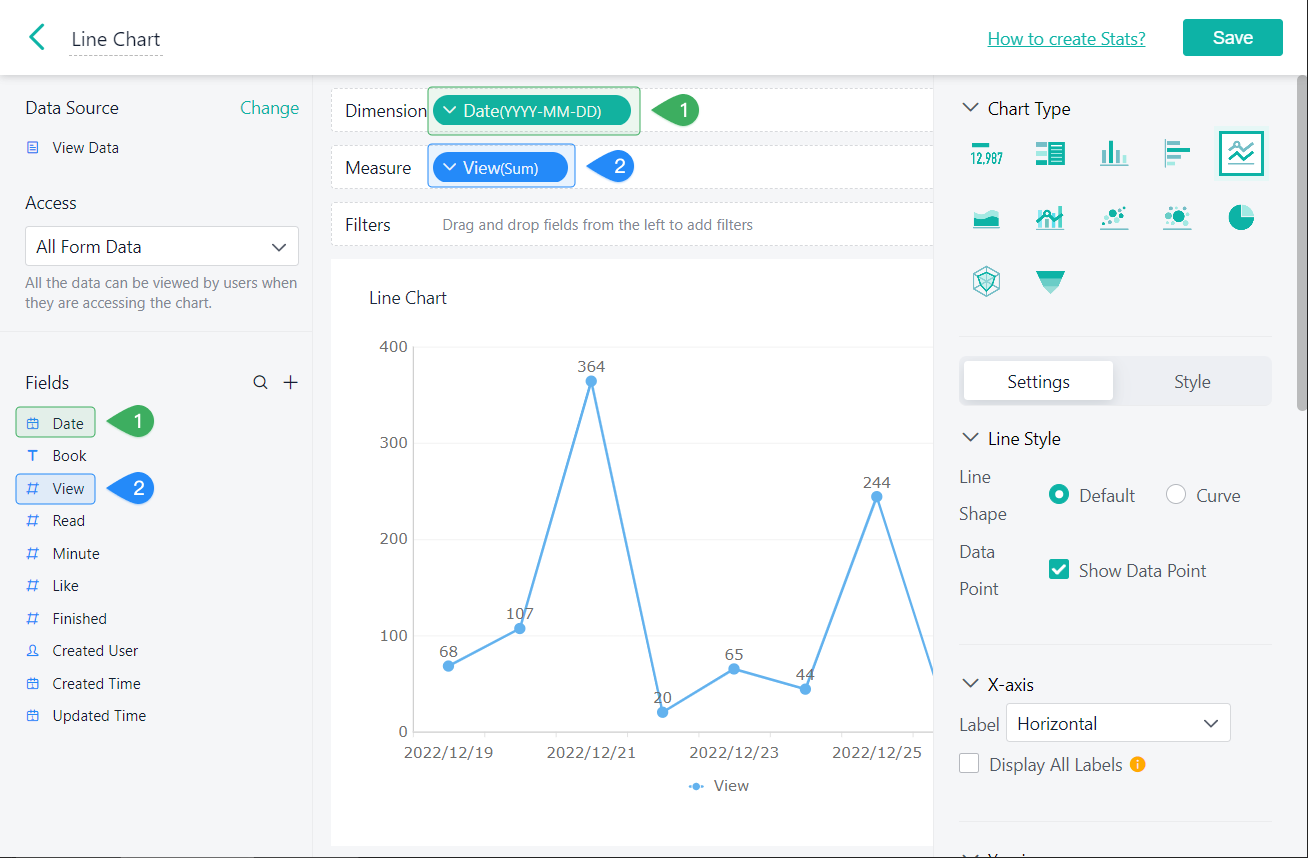
Configuring Functions
Function configuration is to set the axes, data labels and legend of a line chart. For details, see Settings.

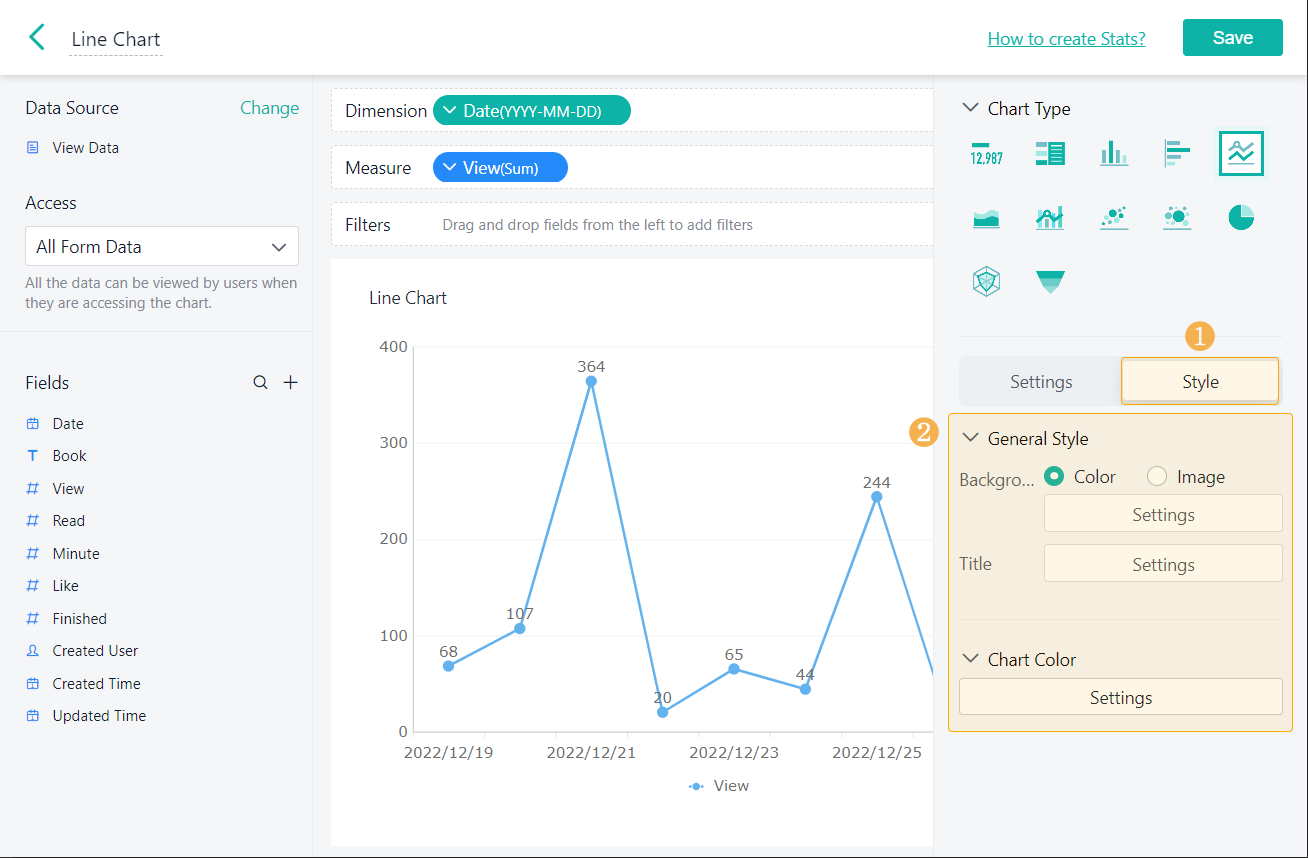
Component Style
After setting up Dimension and Measure of the line chart, you can configure the component style.
Demonstration
1. On PC

2. On Mobile
