


Showing Missing Time
Introduction
Functions
When data is aggregated based on the Date&Time field, there may be no data in a certain date dimension.
Date&Time dimensions without data will not be displayed by default in the system. In order to ensure the integrity of the data, you can set Show Missing Time to display dimensions of missing time.
Application Scenarios
To display the data under each Date&Time dimension in the stats, you need to set Show Missing Time to avoid the situation where there is no data to be displayed in some date dimensions.
Preview
After setting Show Missing Time, time dimensions without data will also be displayed on the dashboard. Only the data points will be displayed on the zero scale at the corresponding position.

Setting Procedure
Creating a Dashboard
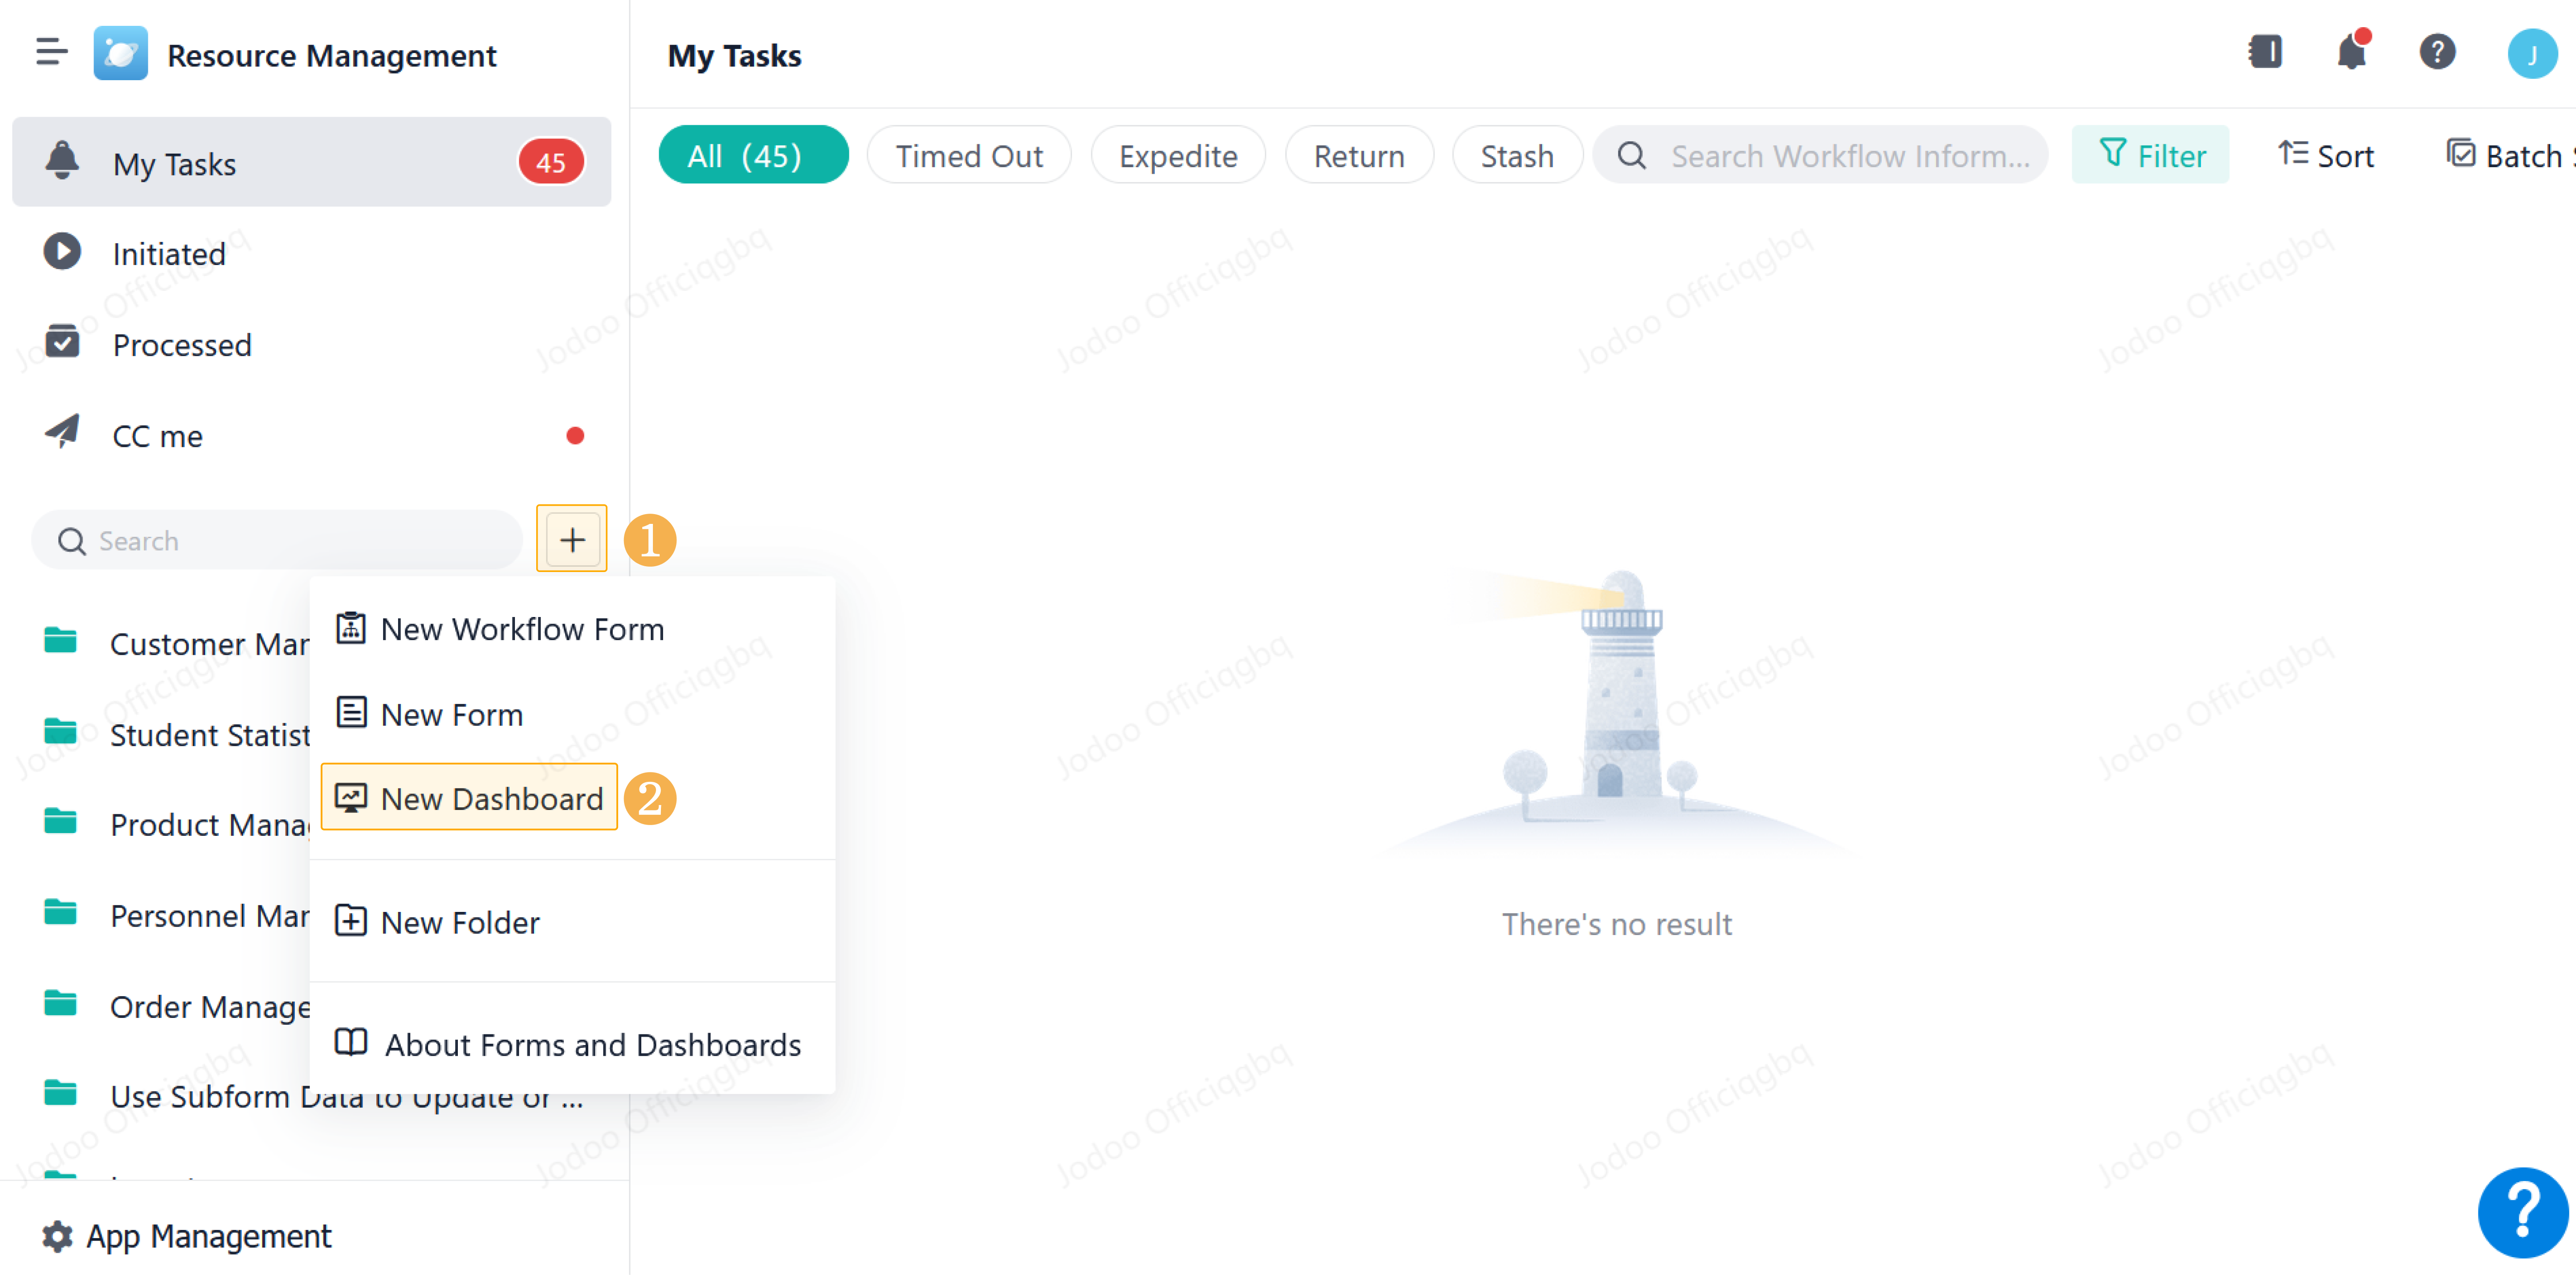
Click > New Dashboard to create a new dashboard:
Creating a Chart
Rename the dashboard, click Stats to create a chart, and select the Gantt-Production Plan form as the data source:

Setting the Chart
Rename the chart and add the fields Start Time and Budget Cost to the dimension and measure respectively.

Next, set as follows:
- Select the Start Time field and set Aggregation to Year-Month-Day.
- Select Line Chart as the chart type.
- Select Line Shape > Curve.

This setting allows displaying the demonstration better.
Demonstration
Click the Start Time field on the dimension, set Show Missing Time, and all data points of missing time from the beginning to the end can be displayed as follows:

Notes
1. Show Missing Time can only be set on Date&Time fields on the dimension.
2. Supported chart types include column chart, bar chart, line chart, area chart, and funnel chart.
3. Only the data of time dimensions between the first and last data point will be displayed, or will not be displayed.